
How Insurance Agency Dashboards Help Teams Track Quotes and Renewals
Why Insurance Agencies Need Better Reporting and Visibility
Insurance agency reporting software and insurance agency analytics turn the daily flow of quotes, requests, and renewals into something a team can see and act on. Without them, an agency runs on memory and inbox searches.
On any given morning, an agency is carrying several kinds of work at once. A new quote request arrives through a web form while another waits on a customer’s driver details. A policy comes up for renewal, a certificate request lands in the shared inbox, and an agent is halfway through a coverage change. Each item is small. Together they form a moving workload that is difficult to hold in anyone’s head, and that is where things start to slip.
Most agencies track this work in a patchwork: a spreadsheet for open quotes, email folders for customer replies, the agency management system for policies, and sticky notes for the rest. Answering a basic question, such as how many quotes are still open or which renewals are two weeks out, means opening several tools and reconciling them by hand. By the time the answer is assembled, it may already be out of date.
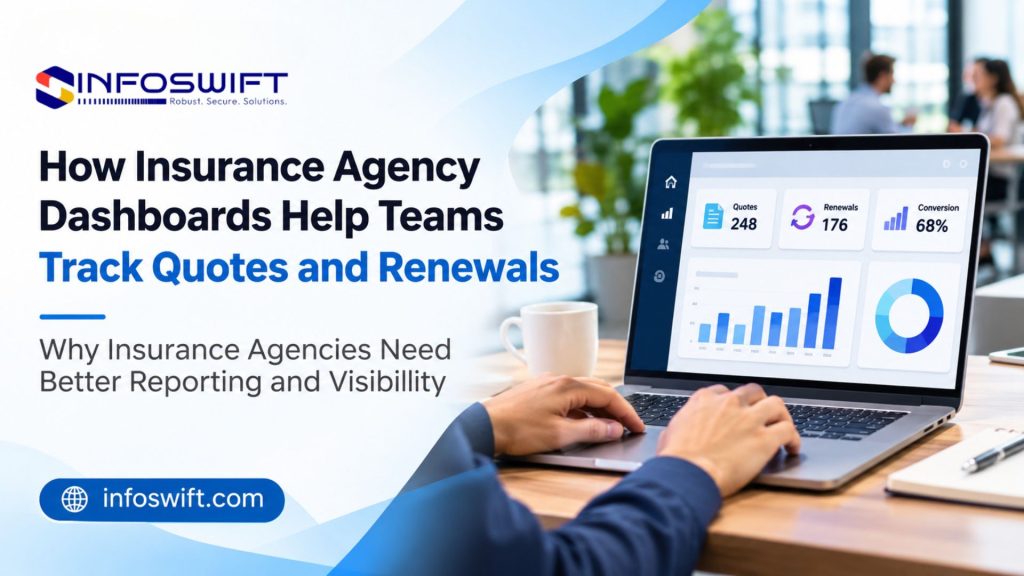
A dashboard changes that by bringing the important operational information into one view. Instead of asking each person for an update, a manager looks at a single screen that shows the state of the work. Insurance agency reporting software makes that possible by collecting data from the systems the agency already uses and presenting it in a consistent form.
Visibility is only the first benefit. Organized data supports better decisions, which is the purpose of insurance agency analytics: seeing which quotes stall, where renewals are at risk, and where the team’s time goes, then acting on what the numbers show. This guide explains what an agency dashboard is, which metrics belong on it, how it helps teams track quotes and renewals, and how to build one.
What Is an Insurance Agency Dashboard?
An insurance agency dashboard is a visual summary screen that shows an agency’s key operational information, such as open quotes, upcoming renewals, and team workloads, in one place and in close to current form.
Behind the screen, the dashboard pulls data from source systems on a schedule or on demand, organizes it into agreed measures, and displays it as counts, charts, lists, and status indicators. Most of the real work happens in the data connections and the definitions. The visible dashboard is the result.
The data usually comes from three kinds of systems:
- Agency management systems: policies, expiration dates, contacts, and servicing activity.
- CRM platforms: leads, notes, scheduled activities, and follow up history.
- Quote applications: quote requests, stages, results, and the agent who handled each one.
What a dashboard can show depends on what those systems record and whether they can share it.
Insurance agency reporting software produces a reporting dashboard, which differs from a basic spreadsheet report even when both show the same numbers.
| Spreadsheet report | Reporting dashboard |
Freshness | A snapshot from the day it was built | Refreshes from its sources on a schedule |
Effort | Someone exports, cleans, and formats it each time | Built once, then maintained |
Consistency | Each author may define terms differently | One set of definitions for everyone |
Use | Good for a one time analysis | Built for daily and weekly decisions |
Interaction | Static unless someone re sorts it | Filters by agent, line, date, or status |
Common Reporting Challenges Insurance Agencies Face
Reporting problems rarely announce themselves. They show up as questions that nobody can answer quickly. Five are especially common.
Difficulty Tracking Multiple Quote Requests
Quote requests arrive through the website, phone calls, referral emails, carrier portals, and walk ins. Each channel may land in a different tool, so an agent has to check several places to know what is open. A request that arrives outside the usual channel can sit unnoticed until the customer calls to ask what happened.
Limited Visibility into Renewal Activities
Without centralized tracking, teams may miss upcoming renewals or overlook pending follow ups. A renewal that was started and then interrupted looks the same as one that was never started, because nothing marks the difference. Managers often learn about the problem when a customer calls or a policy lapses.
Scattered Operational Data
Quote data sits in one tool, policy data in another, and activity notes in a third. Each system answers its own questions well, but none can show how the agency is performing overall. Leaders end up estimating totals, and two people can give two different counts of the same thing.
Delayed Performance Reporting
When reports are assembled by hand, someone exports data, cleans it, builds the tables, and emails the result. That takes hours that could go elsewhere, and the finished report describes last week or last month. Decisions made on old numbers respond to problems that may already have changed.
Difficulty Identifying Workflow Bottlenecks
A quote that takes longer than it should is usually waiting for something: a document, a carrier response, an agent’s attention, or the customer. Without stage level information, the delay looks like general slowness, and the fix becomes a guess. Teams may not see where quotes, customer responses, or renewal activities are getting held up until the delay is already large.
Essential Metrics Every Insurance Agency Dashboard Should Track
A dashboard that tracks everything helps no one. Start with the measures below, grouped by the question each one answers. They form the base for any insurance agency analytics that follows. Write down a definition for every metric before building anything, because a number only helps when everyone counts it the same way.
Quote Pipeline Metrics
- Total quote requests received: every new request in the period, across all channels. It reads as demand.
- Quotes in progress: requests being worked right now. A growing count can signal strained capacity.
- Quotes awaiting customer response: quotes sent or paused for missing information. This is the follow up list.
- Quotes completed: quotes delivered to the customer within the period.
- Quote conversion rate: the share of quotes that become bound policies, commonly quotes bound divided by quotes completed. State the denominator in writing so the rate means the same thing every month.
Policy Renewal Metrics
- Upcoming policy renewals: policies reaching expiration within a chosen window.
- Renewals completed: policies renewed in the period.
- Pending renewal follow ups: renewals where the next action is overdue or has no owner.
- Policies awaiting customer confirmation: renewals waiting on the customer’s answer or documents.
- Renewal completion rate: renewals completed divided by renewals due in the same period. Track it by week, so slippage shows up before the month ends.
Agent Performance Metrics
- Quote requests handled by each agent: the volume each person has taken on.
- Average quote processing time: time from request to delivered quote. Compare it within a line of business, because a simple personal auto quote and a commercial quote are not comparable.
- Customer follow up activity: contacts made on open quotes and renewals.
- Pending tasks and assigned workloads: open tasks per agent. Use these to balance work and offer support, not to rank people on raw counts.
Customer Activity Metrics
- New customer inquiries: first contacts from people who are not yet quoted.
- Follow up requests: customers asking for status, changes, or a call back.
- Customer response status: replied, not replied, and the number of days waiting.
- Outstanding document requests: items requested from customers and not yet received.
Agency Operations Metrics
- Daily and monthly quote activity: volumes by day and by month, which show the busy periods.
- Renewal workload: renewals due per week, compared with the people available to handle them.
- Team productivity: completed items per person per period, read with context.
- Outstanding tasks: all open tasks, sorted by age.
- Workflow completion trends: the share of workflows finishing on time, followed across several periods.
Metrics depend on the data available in the agency’s connected systems and on how the dashboard is configured. If a system does not record a status, no dashboard can report on it until the agency starts capturing it.

How Insurance Agency Dashboards Help Teams Track Quotes and Renewals
Good insurance agency reporting software makes the metrics useful by shaping a working day. Think of the dashboard as a set of views, each built for a decision that someone makes daily or weekly. Longer term trend reading is covered in the analytics section below.
Provide a Centralized View of Quote Requests
One screen lists every open request regardless of the channel it arrived through, with the oldest or most urgent at the top. An agent starts the morning there instead of in four inboxes. Flags mark requests with no assigned owner, so no request depends on someone happening to notice it. The tools that capture and manage these requests are compared in insurance quote management software features.
Monitor Quote Pipeline Progress
A quote pipeline dashboard organizes requests by stage, such as new, in progress, pending, and completed. Each column shows a count and the age of its oldest item. If the pending column is growing while new requests slow down, the problem is follow up, not demand, and the manager knows where to look.
Track Upcoming Policy Renewals
A renewal view grouped by expiration week, with a status beside each policy, lets the team work from the nearest date backward. Renewals with no recent activity can be flagged, which catches the interrupted ones that otherwise look normal. The dashboard shows where to act. The routine work that follows, such as reminders and document requests, can be handled with insurance renewal automation.
Identify Delayed Customer Responses
A single waiting list, ordered by days waited, replaces scattered memory. Agents can see which customers need a second message, which need a phone call, and which requests have been silent for so long that the quote should be revisited or closed. Each waiting item shows what is missing, so the follow up asks for something specific.
Improve Team Workload Management
A workload view places each person’s open items beside their due dates. When one agent’s list is crowded and another’s is light, the manager can reassign work today, instead of discovering the imbalance after a deadline passes. It also shows who is available to cover when someone is out.
Support Data-Driven Decisions
Because the same measures stay visible week after week, a change in direction is noticed early. A drop in new requests, a longer pending column, or a rise in renewals awaiting confirmation each prompts a question while there is still time to act on it. The next section explains how to read those trends.
Key Features to Look for in Insurance Agency Reporting Software
Evaluate insurance agency reporting software on how it handles your data and your people, not on how polished a demonstration looks. The table lists ten features, why each matters, and a test to run during a trial.
Feature | Why it matters | Test to run |
Customizable reporting dashboards | Agents and managers ask different questions | Have one agent and one manager request a view without a developer |
Real time or scheduled data updates | Freshness must match the speed of the decision | Change a record in the source and time how long the dashboard takes to show it |
Quote pipeline visualization | A stage view reveals where requests stall | Rename stages to match your process and confirm item age is shown |
Policy renewal tracking | Expirations need to be visible well ahead of time | Filter renewals by week, agent, and status |
Agent performance reports | Handling volume and time support fair workload decisions | Check that these reports can be limited to managers |
Customer activity monitoring | Waiting items and requests belong beside the customer record | Confirm inquiries, replies, and document requests appear in one place |
Data filtering and segmentation | Totals need to be sliced by line, carrier, office, or source | Apply three filters together and confirm the totals still reconcile |
Exportable reports | Some users need data outside the tool | Export a view and confirm the file matches the screen |
Role based access controls | Customer and performance data are sensitive | Sign in as each role and confirm it sees only what it should |
Integration with agency management systems and CRM platforms | A dashboard is only as good as its data | Ask which of your systems connect through supported APIs and whether history loads |
No product will lead on all ten. Rank the features against the challenges your agency listed earlier, and score each candidate on its top three.
How Insurance Agency Analytics Can Improve Decision-Making
Dashboards show what is happening. Insurance agency analytics asks why, and what to do about it. The practices below apply to the same data over longer periods, usually reviewed monthly or quarterly instead of daily.
Understand Quote Conversion Trends
Identify how many quote requests progress through the pipeline, then break the rate down by stage, line of business, lead source, and agent, since an overall rate hides the differences that matter. If requests from one source rarely move past the first stage, the cause may be lead quality or the speed of the first response, and each needs a different fix. Compare like with like, because one month of a seasonal line says little about another.
Plan Renewal Activities
A forward looking view of renewal volume by week shows heavy periods before they arrive. Use it to schedule outreach early, arrange time off so key people are not away during a peak, and decide when temporary help is needed. Planning from the numbers replaces the scramble that follows a surprise.
Identify Operational Bottlenecks
Measure how long items stay in each stage, not only how many pass through. A stage with long waits for customer information points to a process fix, such as a better intake form. A stage where work waits for an agent points to capacity. The cause decides the remedy, and the stage data shows the cause.
Improve Resource Allocation
Over several months, patterns show who handles which kinds of work and where people are consistently stretched. Use them to match tasks to strengths, cross train backups, and decide where an extra hire or tool would help most. Present the data as support for the team, not as a scoreboard, because people who feel watched start working to the metric.
Monitor Business Performance Over Time
Compare the same month across years and the same week across seasons, so normal seasonality is not mistaken for a trend. Keep notes beside the numbers about staffing changes, new products, or marketing campaigns. A chart without context invites the wrong explanation.
Steps to Build an Effective Insurance Agency Dashboard
An insurance agency dashboard succeeds when it answers real questions. These nine steps begin with the questions and end with ongoing use. Each includes a pitfall to avoid.
- Identify the agency’s reporting requirements. List the questions managers and agents ask each week and who asks them. Avoid asking for everything, which produces clutter nobody reads.
- Select the key quote, renewal, and operational metrics. Choose a short set from the groups above and write a definition for each. Avoid undefined terms, such as an active quote that means different things to different people.
- Identify the systems that contain the required data. Map each metric to the system and field that holds it. Better to discover now that a needed fact is recorded nowhere than after the build.
- Connect relevant applications where supported. Use supported APIs, connectors, or scheduled exports, and check permissions and usage limits. Avoid assuming that every tool offers an interface.
- Organize and validate the collected data. Standardize statuses, remove duplicates, and compare dashboard totals with reports from the source systems. Keeping that data consistent over time is the subject of insurance agency data management. Avoid building before cleaning.
- Design dashboard views for agents and managers. Agents need task lists, and managers need summaries and exceptions. Avoid one crowded screen meant for everyone.
- Configure reporting filters and update schedules. Set filters for agent, line of business, date range, and status, and choose refresh times by how quickly each decision is made.
- Test dashboard accuracy and access permissions. Check numbers against cases you know by heart, and sign in as each role to confirm what it can see.
- Review dashboard usage and improve reports over time. Look at which views are opened and which are ignored, retire the unused ones, and add new views as new questions arise.
How InfoSwift Can Help Build Connected Insurance Reporting Solutions
InfoSwift supports agencies that need better visibility across their insurance applications and workflows. A useful way to understand the work is through the questions a dashboard owner has to answer, since each service answers one. For the wider range of InfoSwift’s agency work, see its insurance agency software solutions.
Custom Dashboard Development
What do we need to see? InfoSwift builds dashboard solutions around specific agency reporting requirements, so the views match how your teams work, such as a pipeline organized by your own stages instead of generic ones.
Insurance API and Application Integration
Where will the data come from? InfoSwift connects relevant business applications to bring data into a centralized reporting environment, where supported APIs and permissions are available. Each source is checked for what it can share before the design depends on it. The agency’s integration services page has more detail.
Insurance Workflow Automation
What happens when the dashboard shows a problem? InfoSwift helps streamline repetitive quote and renewal activities through customized workflows, such as creating a task or sending a reminder when an item has waited too long.
Legacy Application Modernization
Can the older system supply the data? InfoSwift modernizes older applications to support improved data access and connected operations, so information locked inside an aging system can reach the reporting environment.
Quality Assurance and Data Validation
Can we trust the numbers? InfoSwift tests reporting functionality, data accuracy, and application integrations, including reconciling dashboard totals with source records before the team relies on them. See the testing services overview.
Give Your Team One Clear View of Quotes and Renewals
Quotes and renewals fill an agency’s days, and tracking them across spreadsheets, inboxes, and separate systems costs time and invites missed follow ups. A dashboard gathers that work into one view, and insurance agency reporting software keeps the view connected to the data behind it.
The value grows when the numbers are used. Daily views keep requests moving, and insurance agency analytics shows where the process itself needs to change. Both depend on clear metric definitions, clean source data, and connections that have been tested.
Start small. Pick the five questions your team asks most often, find where each answer lives, and build the first view around them. Once people trust it, add the next one.
Build a Clearer View of Your Agency with InfoSwift
To discuss custom dashboards, application integration, or workflow automation for your quotes and renewals, start a conversation with InfoSwift.
Frequently Asked Questions
It is software that collects data from an agency’s systems, such as the agency management system, CRM, and quote tools, and presents it as dashboards and reports covering operations, workloads, and results. Some products are standalone, some are reporting modules inside a management system, and some are built to an agency’s own requirements.
Begin with a short set in four groups: quote pipeline counts, renewal status and completion, workload per agent, and outstanding customer items. Add a metric only when someone will make a different decision because of it. What you can include is limited by what your connected systems record, and the same limit applies to any insurance agency analytics built on top.
Think of it as a to do list with context. An agent opens it, sees assigned requests ranked by age, and records outcomes as work finishes. Because status is visible to colleagues, a request does not stall when its owner is out, since someone else can pick it up and see what has already been done.
Yes, provided the expiration dates and renewal statuses exist in a connected system. A dashboard reads these dates and does not create them, so its accuracy depends on the source data. Pair the view with a routine for renewals showing no recent activity.
Often, through supported APIs, connectors, scheduled exports, or database access, depending on the system and the vendor’s terms. Ask whether the connection is read only, how often it updates, and whether historical data loads. If a system offers no usable interface, an interim export or modernization of that system may be needed.
Match the refresh rate to the speed of the decision. Views used to triage the day, such as new quote requests and overdue follow ups, benefit from frequent updates. Views used for planning and trends, such as monthly conversion, can refresh daily or less often. Faster refreshes can add load and expense, so skip them where nobody will act on the difference.
Yes. Typically each role gets its own view: agents see their assigned work, service staff see requests and document status, managers see summaries and exceptions, and owners see trends. Role based access keeps each group to what it needs.